The Weekender
- Who We Serve
- What We Do
- About Us
- Insights & Research
- Who We Serve
- What We Do
- About Us
- Insights & Research
Investment Perspective · 04.27.26
Save to bookmarks
Demystifying the Market Rally
Global equities have rebounded sharply. We examine what’s driving the rally, where fundamentals remain supportive and how our positioning has evolved.
- Volatility & Risk
- Multi-Asset Insights
- Markets & Economy
Format
Change Format: Choose the format you prefer, and we'll remember your preference next time.
Demystifying the Market Rally
Save to bookmarks
Save to bookmarks
Key Points
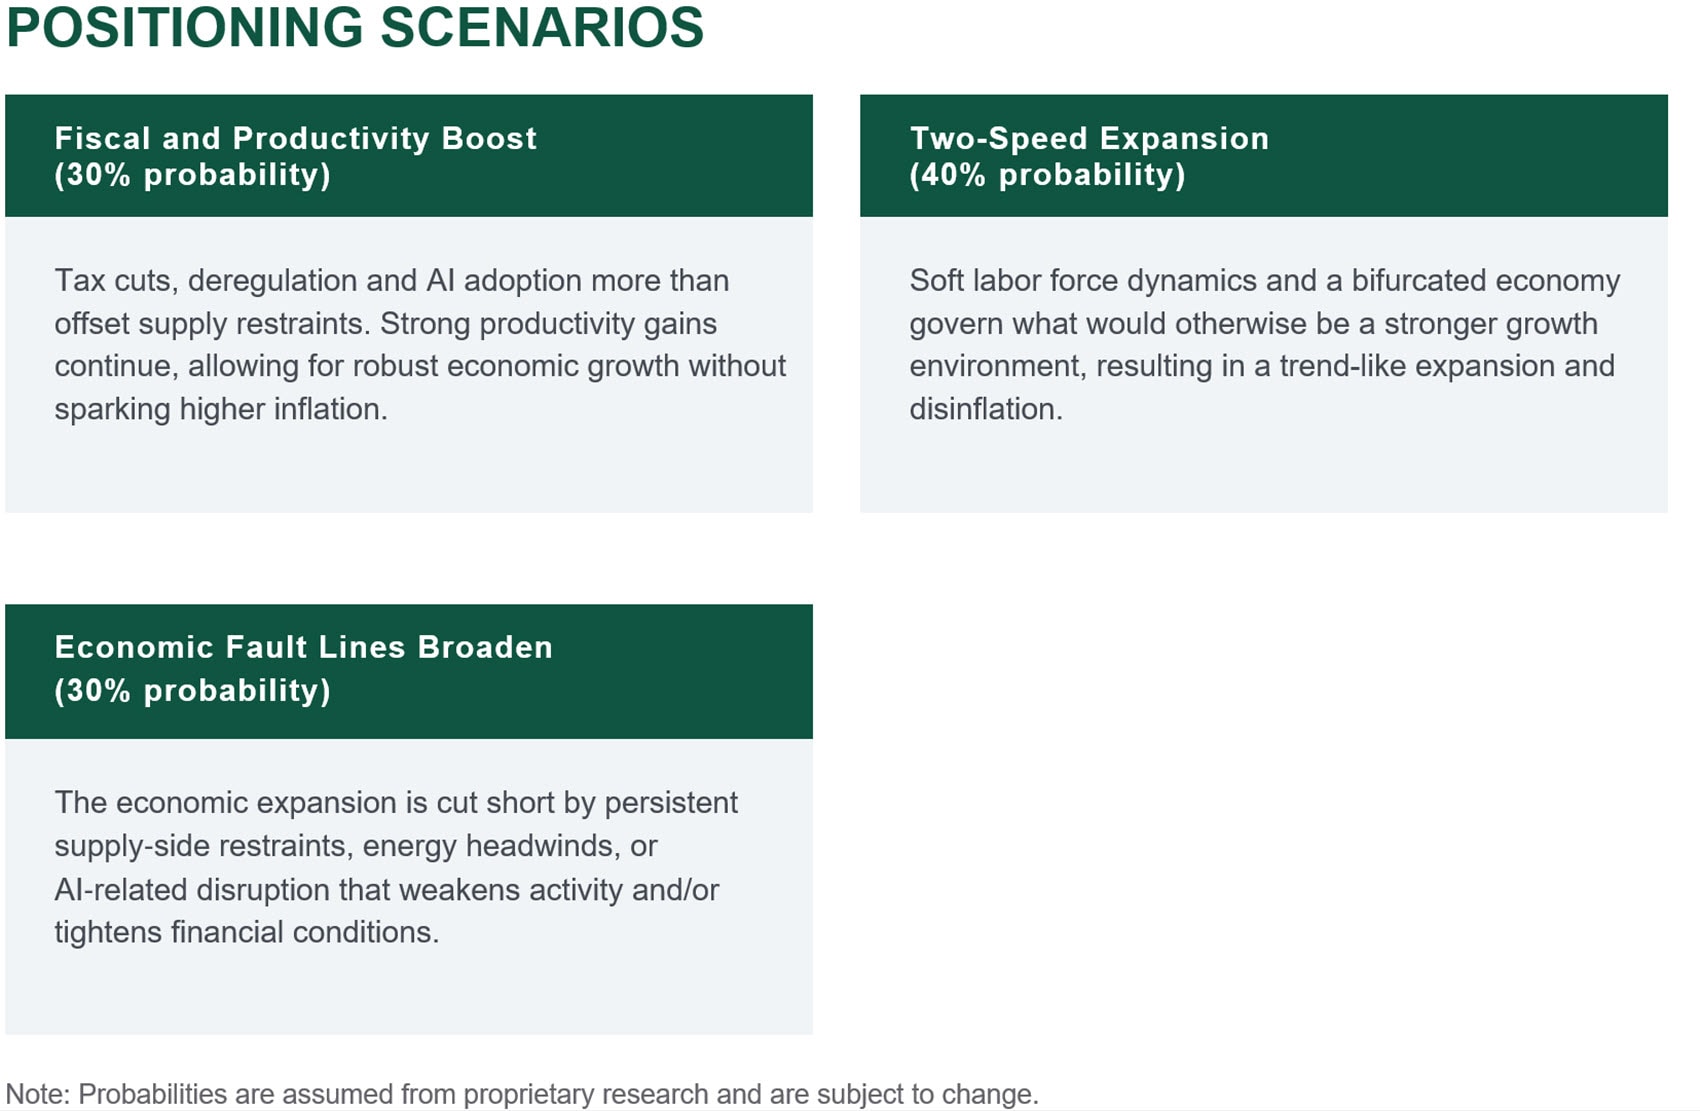
Earnings expectations are unusually strong for the mid-cycle environment. We examine the role fundamentals and the AI investment cycle play in the rally.
From a tactical positioning perspective, we waited through the March weakness, expecting that the geopolitical shocks would give way to strong rallies.
This month, we’ve made portfolio adjustments that reflect progress toward a more durable resolution with a view that risk has not fully subsided.
After a 9% drawdown, global equities have recovered and recently moved on to new highs. While the Iran war remains unresolved and conditions remain fragile — given the ongoing U.S. naval blockade and the absence of an obvious path to a negotiated agreement — recent weeks saw an increased focus on negotiations and ceasefire efforts. Even tentative progress has proven powerful amid depressed investor sentiment and following a period of de-risking. This has helped fuel a strong rally so far in April, with global equities advancing in 12 of the first 13 trading days, marking a historically robust bounce from what was a relatively contained drawdown.
While oil prices remain elevated and the conflict remains unresolved, the market’s focus has shifted toward fundamentals. U.S. equity valuations de‑rated at the onset of the conflict, yet earnings expectations have continued to grind higher. Consensus now expects U.S. earnings growth of roughly 18% in 2026, up from about 13% at the start of the year, followed by another 16% increase in 2027. This represents an unusually strong earnings trajectory for a mid‑cycle environment. Europe is also expected to see solid earnings growth, although earnings resilience outside the U.S. has been strongest in Asia. At the sector level, most areas have seen positive earnings revisions, led by technology and energy. Within technology, upgrades have been broad-based, with semiconductors and hardware standing out. The ability of earnings expectations to remain firm through the macro shock reinforces the view that the AI investment cycle represents a structural source of support for equity markets. That said, it may not be entirely immune to Middle East disruptions. This earnings season, we will be closely monitoring company guidance for signs that higher commodity prices or longer delivery times could slow data center buildouts and other AI-related capital spending.
The outperformance of AI beneficiaries naturally raises the question of earnings concentration. While it is true that a significant portion of aggregate earnings strength has come from technology stocks, the contribution from companies outside a cohort of mega-cap U.S. tech stocks has improved materially from recent years. Furthermore, earnings growth for the median stock remains healthy.
From a tactical positioning perspective, we remained patient through the March weakness, waiting for greater clarity on the durability of the conflict and recognizing that geopolitical shocks often give way to strong rallies once uncertainty peaks. With natural resources up roughly 20% on the year and left‑tail risk lower than at the onset of the conflict, we trimmed our overweight to natural resources back to neutral. We redeployed the proceeds into global real estate, where lower perceived conflict risk should support both equity-sensitive and interest-rate-sensitive assets. These moves were modest and incremental, reflecting progress toward a more durable resolution, but not a view that risk has fully subsided.
Peter Wilke, CFA – Head of Tactical Asset Allocation, Global Asset Allocation
TECH UPGRADES
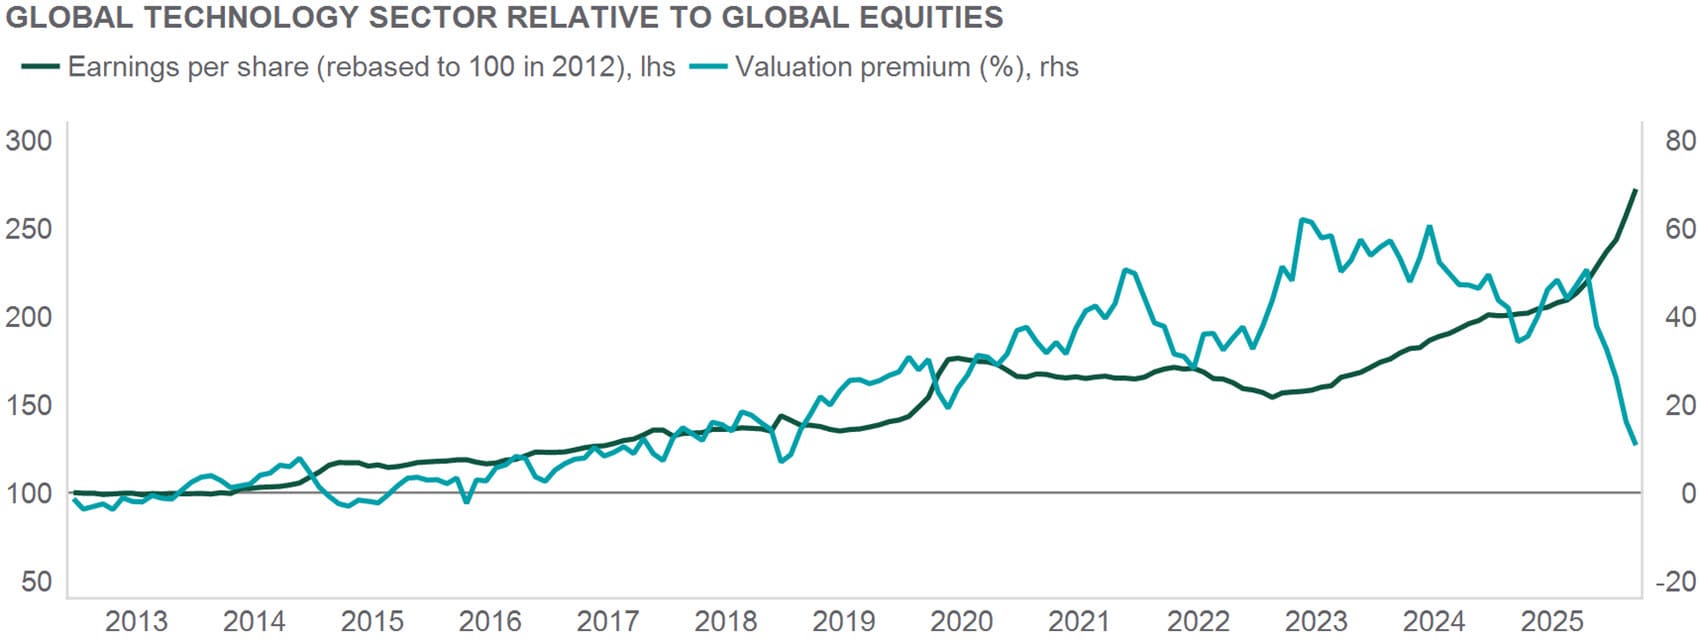
Source: Northern Trust Asset Management, Macrobond, MSCI. Data from 12/31/2012 through 3/31/2026. Historical trends are not predictive of future results.
Interest Rates
In its last meeting, the Federal Open Market Committee (FOMC) left its main policy rate unchanged, with Governor Stephen Miran casting the lone dissent in favor of a 25‑ cut. While the decision itself was anticipated, Federal Reserve Chair Jerome Powell struck a more hawkish tone during the press conference, prompting a noticeable rise in U.S. Treasury yields. The post‑meeting statement was largely unchanged, aside from the addition of language noting uncertainty around the implications of developments in the Middle East.
That uncertainty featured prominently in Powell’s remarks. While acknowledging it remains too early to assess the full economic impact of the conflict, he cautioned that a succession of shocks — tariffs, the pandemic and now energy — raises the risk of inflation expectations becoming unsettled. Powell emphasized that while policy remains flexible and cuts are still possible, progress toward the Fed’s 2% inflation target remains a prerequisite. Although the median projection continues to show one rate cut this year, policymakers expressed heightened concern about upside risks to inflation alongside growing downside risks to employment, underscoring the persistent tension within the Fed’s dual mandate that existed even prior to the war.
HOLDING THE LINE
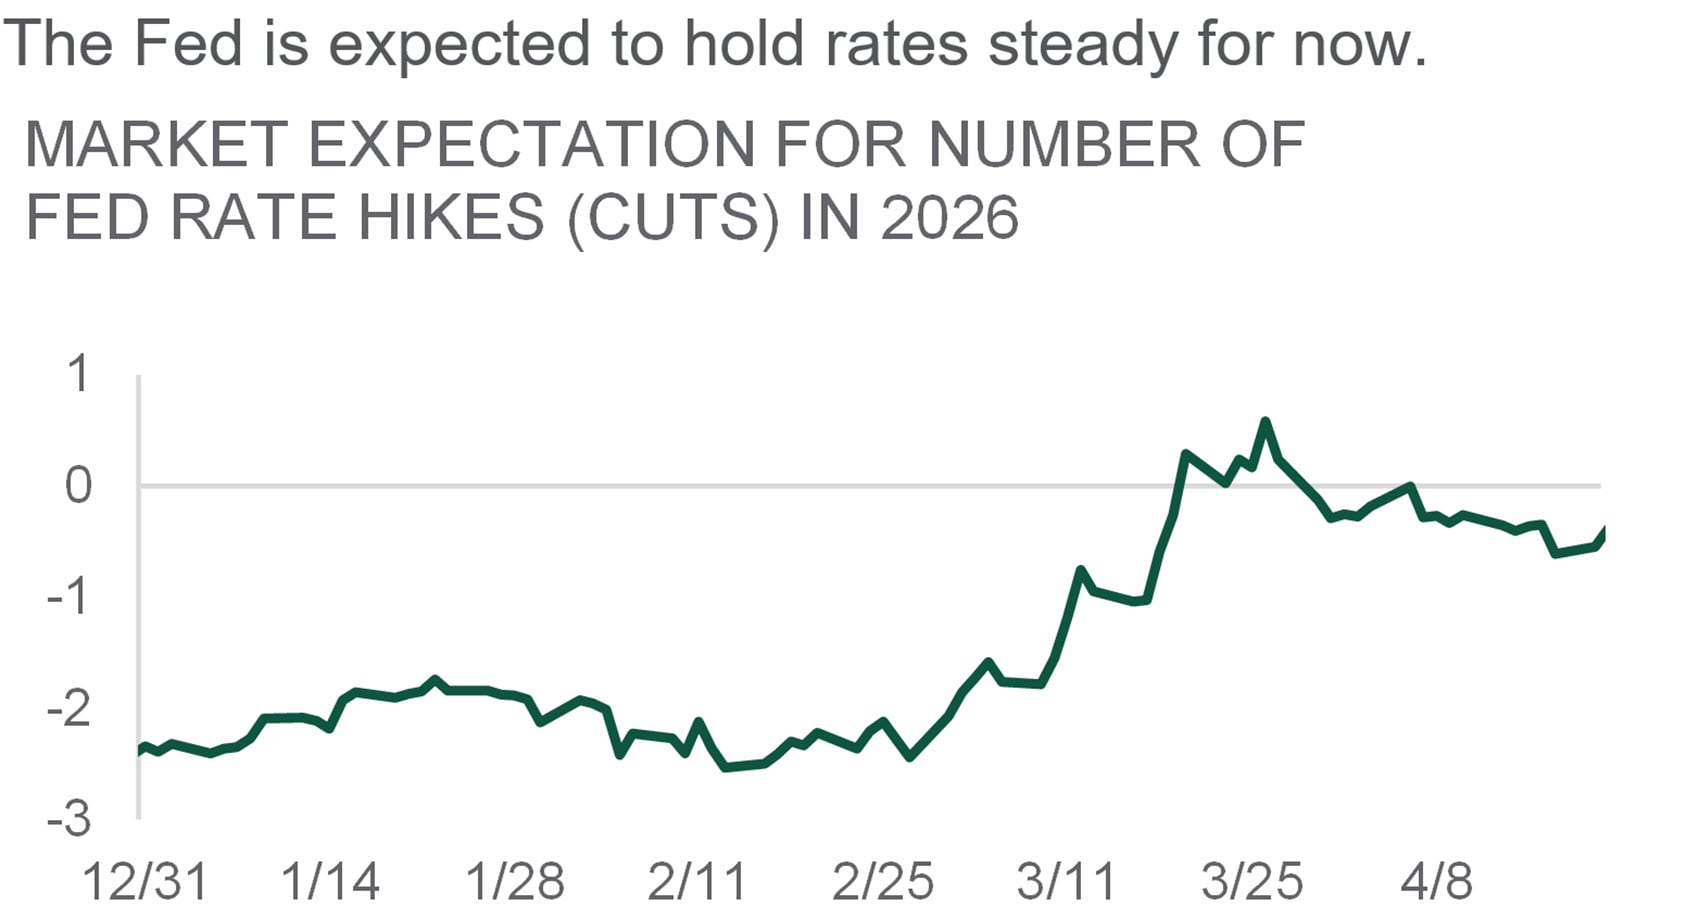
Source: Northern Trust Asset Management, Bloomberg, Macrobond. Market expectations implied by Fed Funds Futures (25-basis-point increments). Data from 12/31/2025 through 4/20/2026. Historical trends are not predictive of future results.
- The FOMC left its policy rate unchanged again.
- The developments in the Middle East add even more uncertainty to the outlook.
- Risks have increased on both sides of the dual-mandate, prompting the Fed to hold rates steady for now.
Credit Markets
In March, the combination of the Iran war, an interest‑rate sell‑off and elevated M&A‑related supply drove the worst monthly performance for high yield since 2023. Meanwhile, high‑yield coupons have risen 97 (bps) from December 2021’s record low to roughly 6.7%, as issuers refinance into higher‑cost debt. While long‑run average total returns for high yield broadly track coupon income, year‑to‑year outcomes rarely do. In any given year, high yield almost never delivers a “coupon‑type” return. For example, the median annual differential between total returns and coupon is roughly 640 bps.
With that said, excess returns beyond coupon income are positive about half the time, underscoring the role income often plays in cushioning total returns. There have been five instances over the past 25 years where annual total returns were within 200 bps of the starting coupon: 2011, 2013, 2017, 2020 and 2021. By contrast, there have been just two years — 2008 and 2022 — when price declines fully offset the market’s coupon.
— Ben McCubbin & Sau Mui, Co-Heads of High Yield, & Matthew Brink, Fixed Income Trader
SUPPLY HEADWIND
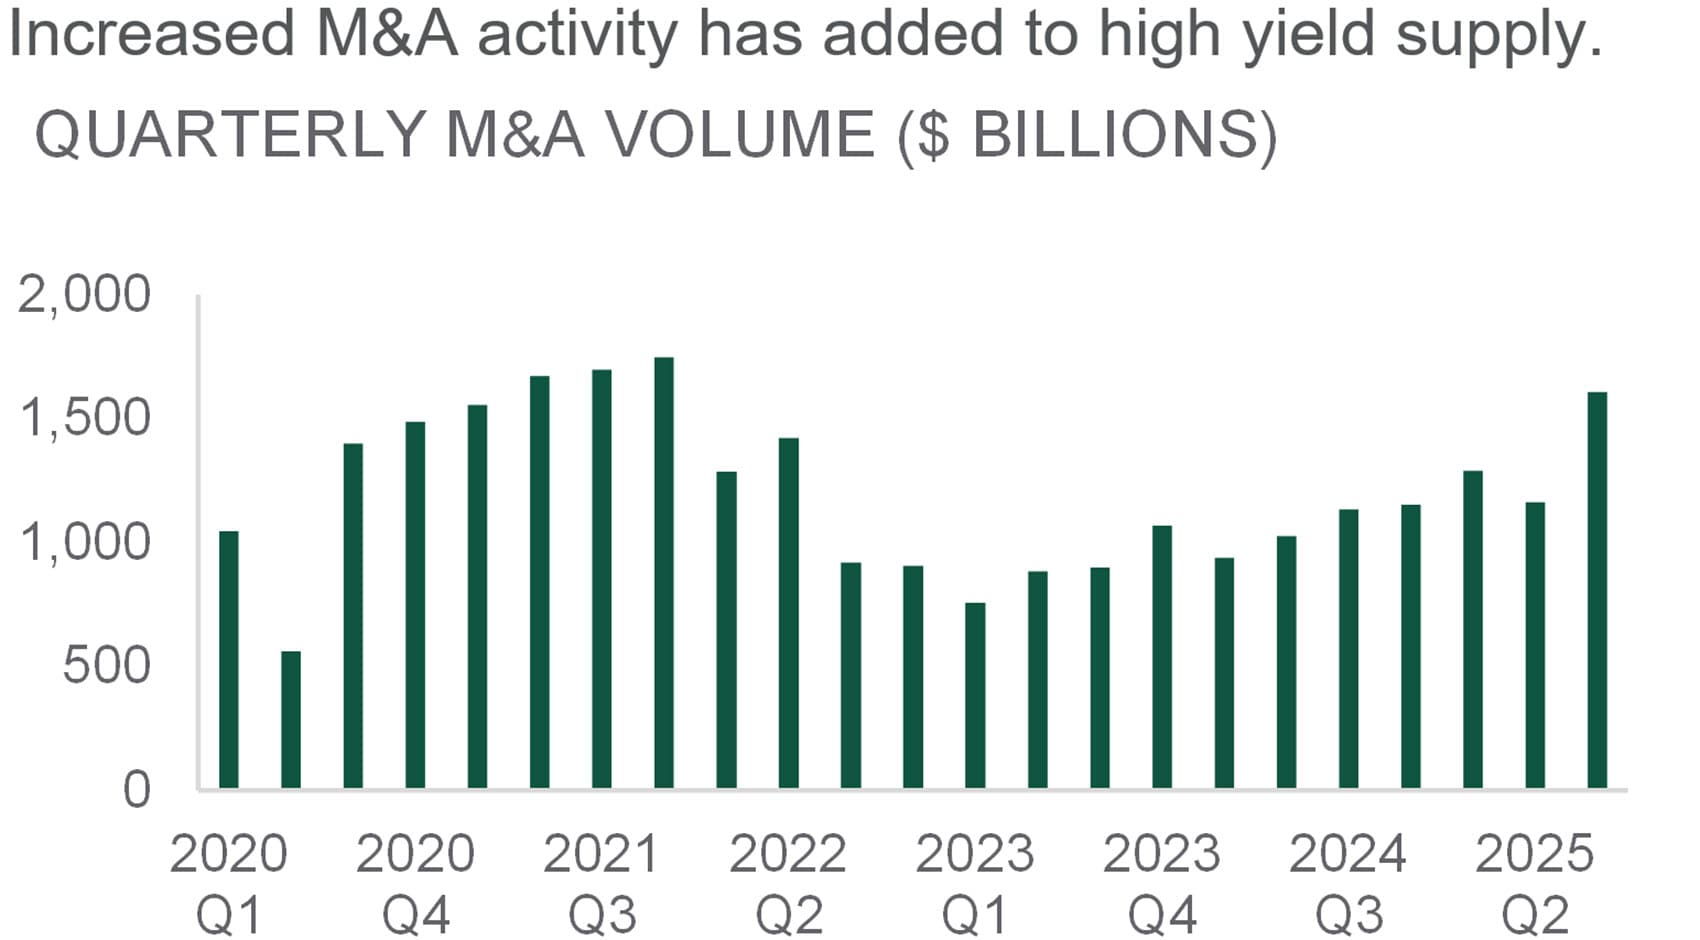
Source: Northern Trust Asset Management, Bloomberg. Data from 2020 Q1 through 2025 Q3. M&A = mergers and acquisitions. Historical trends are not predictive of future results.
- March was a tough month for high yield amid the Iran war, higher interest rates and supply headwinds.
- High yield coupons have risen about a percentage point above December 2021’s record low.
- Excess returns beyond coupon income are positive about half of the time for high yield, underscoring the role income often plays in cushioning total returns.
Equities
The Iran conflict has revealed an important distinction in how markets price risk. While geopolitical tension sharply escalated following the onset of the war, U.S. equities ultimately took a different path than energy markets. In the early weeks of April, equity volatility fell with U.S. stocks reclaiming record highs, while oil volatility remained high.
The divergence is not a dismissal of risk, but a shift in perception. For equities, the critical question has become whether the conflict would translate into systemic profit damage. As risk of substantial disruption to economic growth and earnings has eased, equities have edged higher. Oil markets, by contrast, have continued to trade on physical supply risks, shipping disruptions, and uncertainty around enforcement in key energy corridors. The takeaway is not complacency, it is selectivity. U.S. equities have demonstrated an ability to absorb geopolitical shocks when they remain localized and fail to substantially threaten underlying fundamentals. We maintain a constructive but disciplined view on equities overall, while maintaining prudent risk management as the conflict continues to evolve.
— Jordan Dekhayser, Senior Equity Client Portfolio Manager and Daniel Kim, Associate Equity Client Portfolio Manager
WHEN VOLATILITY DIVERGES
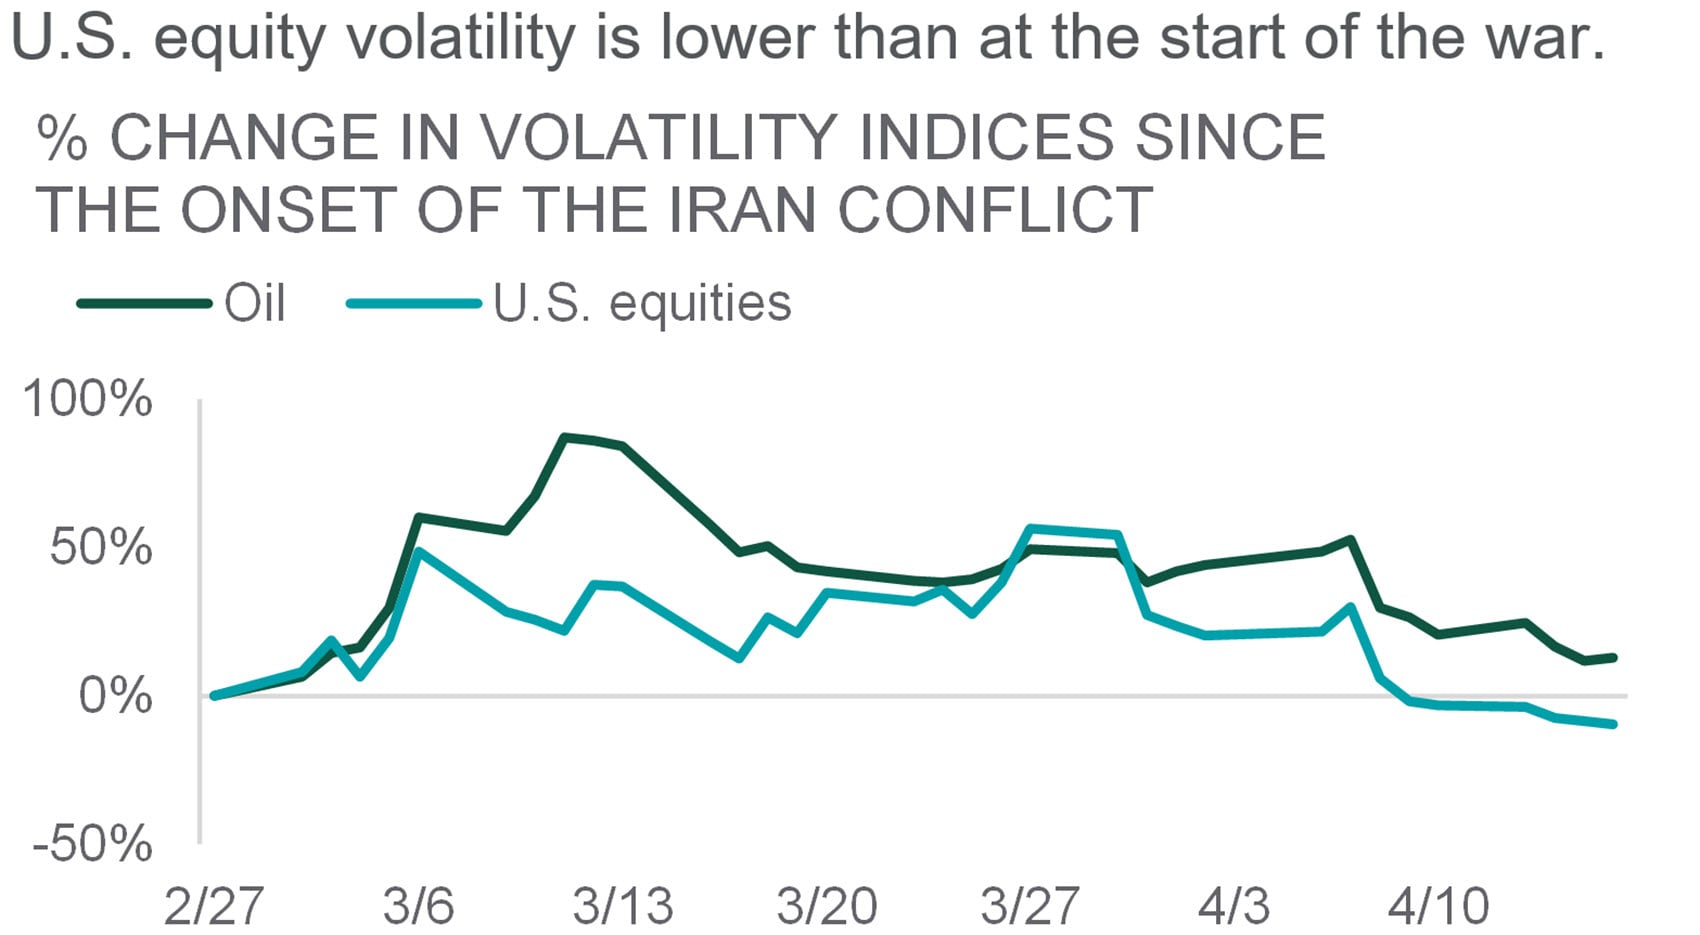
Source: Northern Trust Asset Management, Bloomberg. Volatility indices: ; . Data from 2/27/2026 through 4/16/2026. Past performance is not indicative or a guarantee of future results. Index performance returns do not reflect any management fees, transaction costs or expenses. It is not possible to invest directly in any index.
- U.S. equity volatility is lower than it was at the start of the Iran conflict. Oil price volatility is still elevated.
- Equities have benefitted from lower perceived risk of a major shock to economic activity and corporate profits.
- We maintain a constructive but disciplined view on equities overall.
Real Assets
We reduced our allocation to Natural Resources to equal weight and moved our underweight to Global Real Estate closer to neutral. The key rationale was that left‑tail risk from the war is perceived to be lower than before, which poses potential downside to Natural Resources following strong year-to-date performance, and should be more supportive of interest‑rate‑sensitive asset classes. We also reaffirmed our overweight to the S&P Global Listed Infrastructure (GLI) Index, which has delivered a healthy dividend yield of roughly 3–5% over the past couple of decades, supported by stable demand and cash‑generative business models.
Beyond its headline yield, GLI offers the potential for dividend growth over time, unlike fixed bond coupons. That growth is supported by a combination of organic earnings expansion — often benefiting from inflation linkage — and gradual increases in payout ratios. More broadly, infrastructure is characterized by pricing power, high barriers to entry, and predictable cash flows, which tend to produce steadier earnings growth and lower cyclical sensitivity than general equities. Many assets also benefit from explicit or implicit inflation pass‑through, providing a durable foundation for stable and growing dividends.
PAYING DIVIDENDS
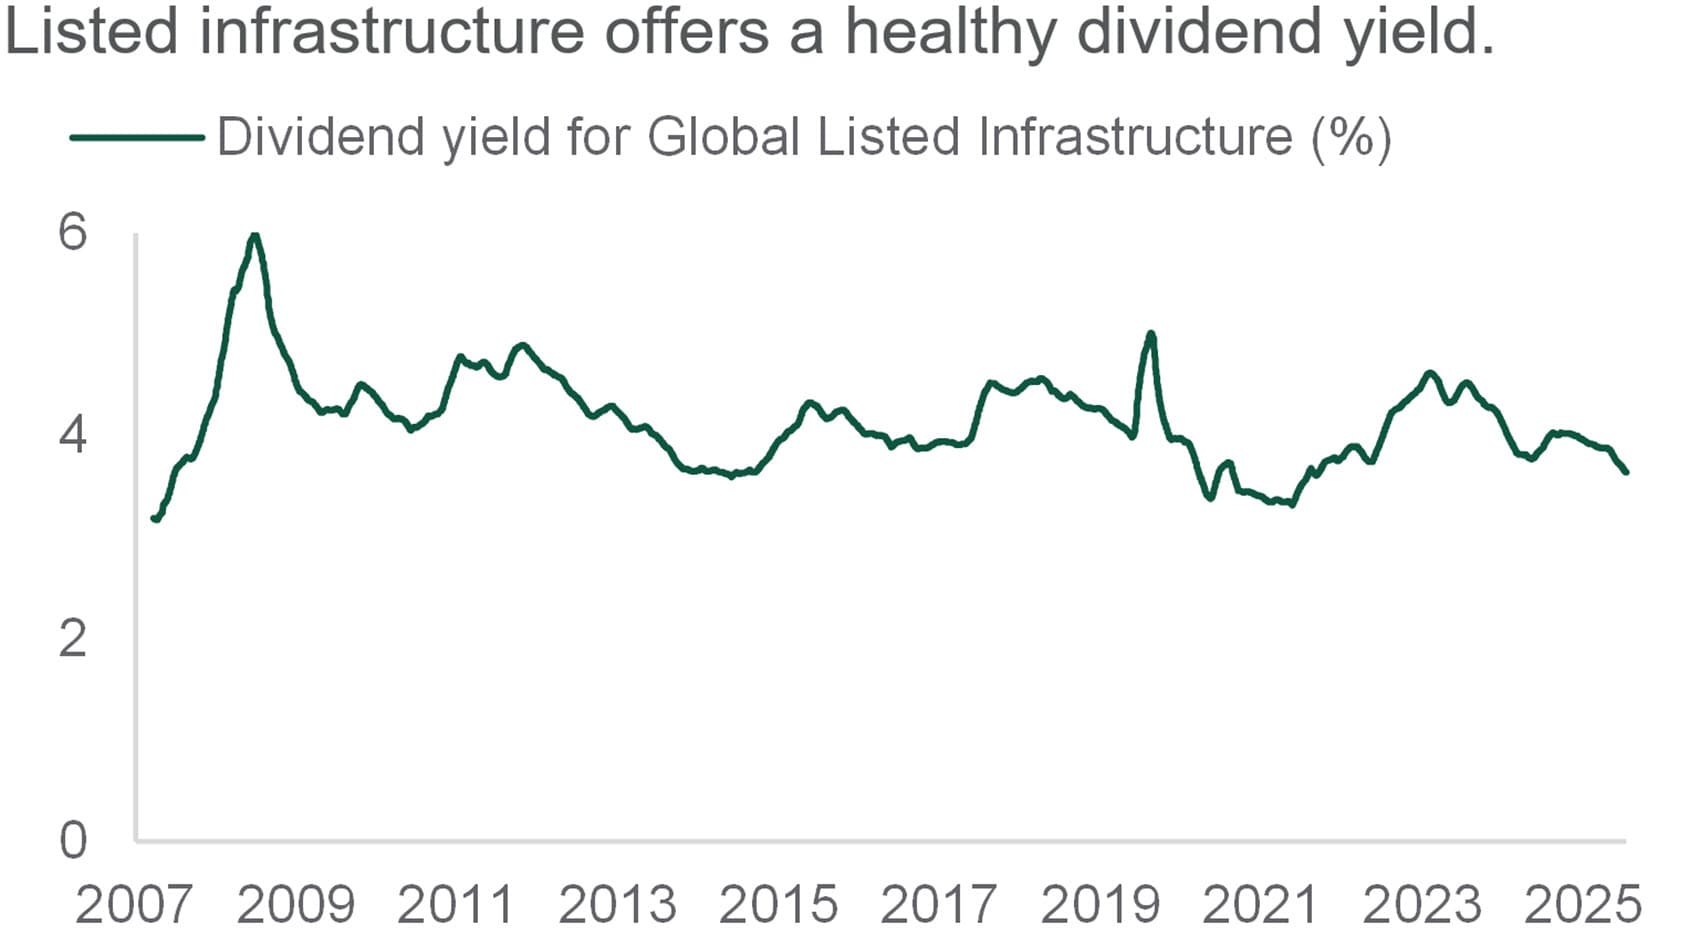
Source: Northern Trust Asset Management, Bloomberg. 60-day moving average forward dividend yield for (GLI) from 12/31/2007 through 4/20/2026. Past performance is not indicative or a guarantee of future results. Index performance returns do not reflect any management fees, transaction costs or expenses. It is not possible to invest directly in any index.
- Listed infrastructure dividend yields have typically averaged 3-5%.
- These income returns tend to grow over time along with revenues and earnings growth. Earnings tend to be more predictable than general equities.
- We reaffirmed our tactical overweight to GLI, while reducing natural resources to add to global real estate.
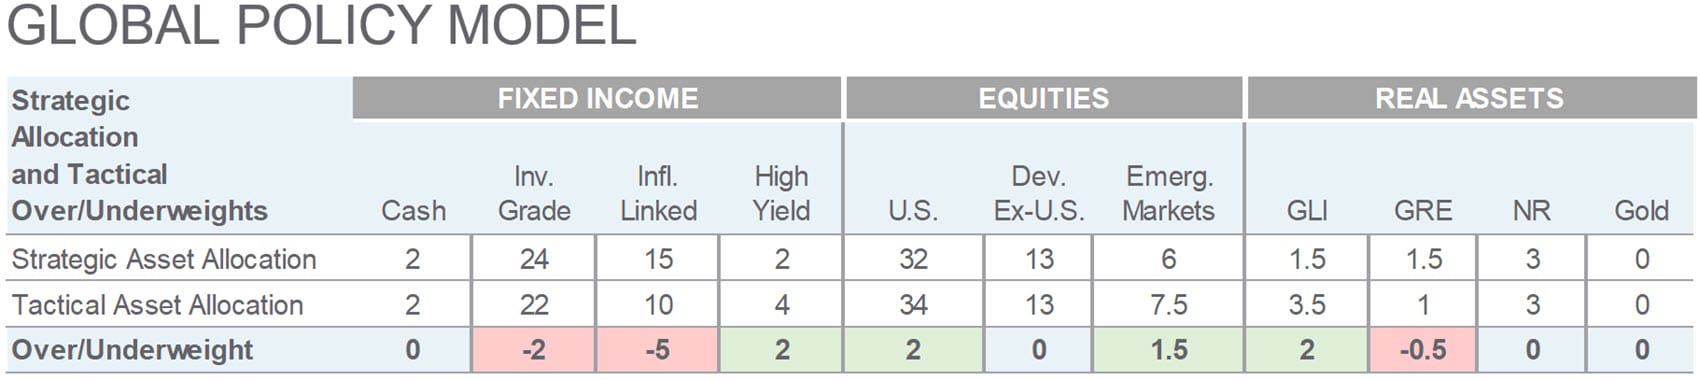
Source: Northern Trust Capital Market Assumptions Working Group, Investment Policy Committee. Strategic allocation is based on capital market return, risk and correlation assumptions developed annually; most recent model released 1/14/2026. The model cannot account for the impact that economic, market and other factors may have on the implementation and ongoing management of an actual investment strategy. Asset allocation does not guarantee a profit or protection against a loss in declining markets. GLI = Global Listed Infrastructure, GRE = Global Real Estate, NR = Natural Resources. Unless otherwise noted, the statements expressed herein are solely opinions of Northern Trust. Northern Trust does not make any representation, assurance, or other promise as to the accuracy, impact, or potential occurrence of any events or outcomes expressed in such opinions.
Unless noted otherwise, data in this piece is Sourced from Bloomberg as of April 2026.
Main Point
Making Sense of the Market’s Rebound
The recent rally reflects easing uncertainty and resilient fundamentals rather than a full resolution of geopolitical risk, warranting measured and disciplined positioning.

Contact Us
Interested in learning more about our expertise and how we can help?
{{msci_world_index}}
IMPORTANT INFORMATION
The information contained herein is intended for use with current or prospective clients of Northern Trust Investments, Inc (NTI) or its affiliates. The information is not intended for distribution or use by any person in any jurisdiction where such distribution would be contrary to local law or regulation. Northern Trust Asset Management’s (NTAM) and its affiliates may have positions in and may effect transactions in the markets, contracts and related investments different than described in this information. This information is obtained from sources believed to be reliable, its accuracy and completeness are not guaranteed, and is subject to change. Information does not constitute a recommendation of any investment strategy, is not intended as investment advice and does not take into account all the circumstances of each investor.
This information is provided for informational purposes only and is not intended to be, and should not be construed as, an offer, solicitation or recommendation with respect to any transaction and should not be treated as legal advice, investment advice or tax advice. Recipients should not rely upon this information as a substitute for obtaining specific legal or tax advice from their own professional legal or tax advisors. References to specific securities and their issuers are for illustrative purposes only and are not intended and should not be interpreted as recommendations to purchase or sell such securities. Indices and trademarks are the property of their respective owners. Information is subject to change based on market or other conditions.
All securities investing and trading activities risk the loss of capital. Each portfolio is subject to substantial risks including market risks, strategy risks, advisor risk, and risks with respect to its investment in other structures. There can be no assurance that any portfolio investment objectives will be achieved, or that any investment will achieve profits or avoid incurring substantial losses. No investment strategy or risk management technique can guarantee returns or eliminate risk in any market environment. Risk controls and models do not promise any level of performance or guarantee against loss of principal. Any discussion of risk management is intended to describe NTAM’s efforts to monitor and manage risk but does not imply low risk.
Past performance is not a guarantee of future results. Performance returns and the principal value of an investment will fluctuate. Performance returns contained herein are subject to revision by NTAM. Comparative indices shown are provided as an indication of the performance of a particular segment of the capital markets and/or alternative strategies in general. Index performance returns do not reflect any management fees, transaction costs or expenses. It is not possible to invest directly in any index. Net performance returns are reduced by investment management fees and other expenses relating to the management of the account. Gross performance returns contained herein include reinvestment of dividends and other earnings, transaction costs, and all fees and expenses other than investment management fees, unless indicated otherwise. For U.S. NTI prospects or clients, please refer to Part 2a of the Form ADV or consult an NTI representative for additional information on fees.
Forward-looking statements and assumptions are NTAM’s current estimates or expectations of future events or future results based upon proprietary research and should not be construed as an estimate or promise of results that a portfolio may achieve. Actual results could differ materially from the results indicated by this information. Historical trends are not predictive of future results.
Northern Trust Asset Management is composed of Northern Trust Investments, Inc., Northern Trust Global Investments Limited, Northern Trust Fund Managers (Ireland) Limited, Northern Trust Global Investments Japan, K.K., NT Global Advisors, Inc., 50 South Capital Advisors, LLC, Northern Trust Asset Management Australia Pty Ltd, and investment personnel of The Northern Trust Company of Hong Kong Limited and The Northern Trust Company.
Not FDIC insured | May lose value | No bank guarantee