MarketScape
- Who We Serve
- What We Do
- About Us
- Insights & Research
- Who We Serve
- What We Do
- About Us
- Insights & Research
Investment Perspective · 05.28.26
Save to bookmarks
Narrow But Powerful
Strong earnings are offsetting geopolitical and inflation risks, but gains are concentrated in a small set of companies, leaving markets powerful yet increasingly fragile.
- Volatility & Risk
- Multi-Asset Insights
- Markets & Economy
Key Points
Earnings expectations are carrying equity markets, offsetting geopolitical and inflation risks even as energy pressures keep central banks cautious.
From a tactical positioning perspective, AI‑led technology remains the growth engine, but earnings gains are increasingly concentrated in a small set of semiconductor companies.
This month, we maintained existing portfolio positioning, reflecting a constructive equity stance while remaining mindful of AI‑driven concentration risks.
The fog of war rarely clears quickly. The Iran conflict, which erupted in late February 2026, has already sent shockwaves through global energy markets. Emergency stockpile releases from the International Energy Agency (IEA) have provided periodic relief, but that medicine is finite. Brent crude remains volatile, and the risk of a renewed price spike — should diplomatic progress stall as reserves thin — has not gone away. Bond markets are already reading the small print. Core inflation trends remain skewed upward, driven increasingly by second‑order energy effects rippling through supply chains and transport costs. Central bankers, for their part, show little appetite for dovish pivots; the hawkish drumbeat is likely to persist into the summer.
Yet equity investors have, for now, chosen to focus elsewhere. The corporate earnings season has delivered what the macro backdrop has not: genuine upside surprise. For the , analysts now forecast full‑year 2026 earnings growth of 21.5%, with quarterly growth rates of roughly 20–24% expected through the remainder of the year. Companies are reporting earnings nearly 18% above estimates — the strongest beat rate since early 2021 — with 84% of reporters exceeding consensus. In a market searching for conviction, that matters.
The engine is familiar. Information Technology continues to lead, with sector profit margins approaching 30%, materially above year‑ago levels. AI‑related capital expenditure is doing the heavy lifting. Hyperscaler spending that was already projected near $520 billion now appears headed toward $650 billion or more. The data‑center supercycle is no longer theoretical; it is increasingly visible in reported earnings and forward guidance.
Nowhere is that more apparent than in emerging markets, where the profit story is, paradoxically, even more compelling — and more concentrated. Profit forecasts for Emerging Market (EM) companies have been revised upward by 30% in 2026, against just 10% for U.S. equivalents. Goldman Sachs puts its MSCI EM 2026 earnings growth forecast at 23%, with more than two‑thirds driven by AI‑related demand, as technology hardware and semiconductor profits surge. South Korea and Taiwan sit at the center of this dynamic, increasingly functioning as leveraged plays on global data‑center investment.
That concentration should give investors pause. is, in important respects, no longer a broadly diversified emerging‑markets vehicle; it is a proxy for the Asian tech supply chain.
Global resources equities present a different kind of paradox. Energy companies have benefited from elevated oil prices, while materials firms have been supported by infrastructure spending. We have begun trimming our overweight in natural resources back toward neutral. The earnings boost is real, but unlikely to compound once stockpile dynamics stabilize and geopolitical risk eventually recedes.
The overall read for summer: stay constructive on equities, anchored by an earnings backdrop that remains, for now, genuinely strong. But mind the narrowness. When three semiconductor companies in Taipei and Seoul account for the lion’s share of one entire asset class’s earnings growth, the rally’s power and its fragility are two sides of the same coin.
Peter Wilke, CFA – Head of Tactical Asset Allocation, Global Asset Allocation
MSCI EM INDEX WEIGHTS BY CONSTITUENTS - AI/TECH HOLDINGS DOMINATE
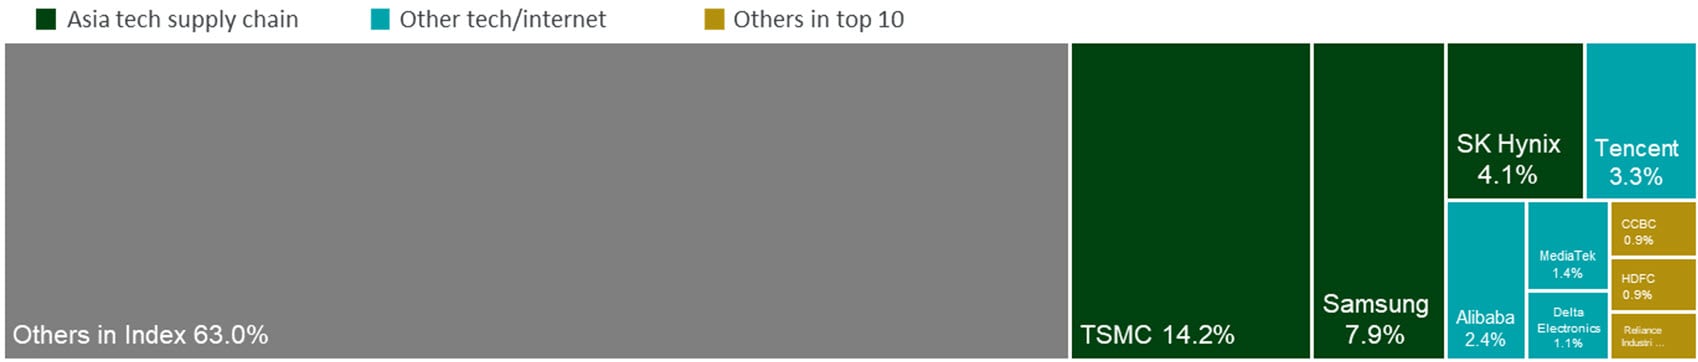
Source: Northern Trust Asset Management, FactSet Earnings Insight (May 2026); Goldman Sachs Research; LPL Research/FactSet; European Business Magazine, Bloomberg. Data as of 4/30/2026. Historical trends are not predictive of future results.
Interest Rates
At the April Federal Open Market Committee (FOMC) meeting, policymakers again left the target range for the Federal funds rate unchanged. The decision was widely expected, but the vote highlighted a more divided Committee. Presidents Hammack, Kashkari and Logan supported maintaining the target range but opposed retaining the easing bias in the statement, while Governor Miran again dissented in favor of a 25-basis-point cut. With no release, markets focused on Chair Powell’s final press conference as Chair for guidance on the policy path and leadership transition. The uncertain economic backdrop and continued conflict in the Middle East reinforced the case for keeping rates unchanged.
Powell said he will remain on the Board as a Governor “for a period of time,” while noting that a majority still supported the easing bias, though that majority has shrunk since March and that “it’s easy to see why”. We view it as likely the Fed Funds Target Range remains unchanged for the remainder of the year, with a cut possible but dependent on additional progress on the inflation side of the Fed’s dual mandate.
- Dan LaRocco, Head of Liquidity, Global Fixed Income
NOT WELL AND TRULY OVER YET
The Fed remains on hold.
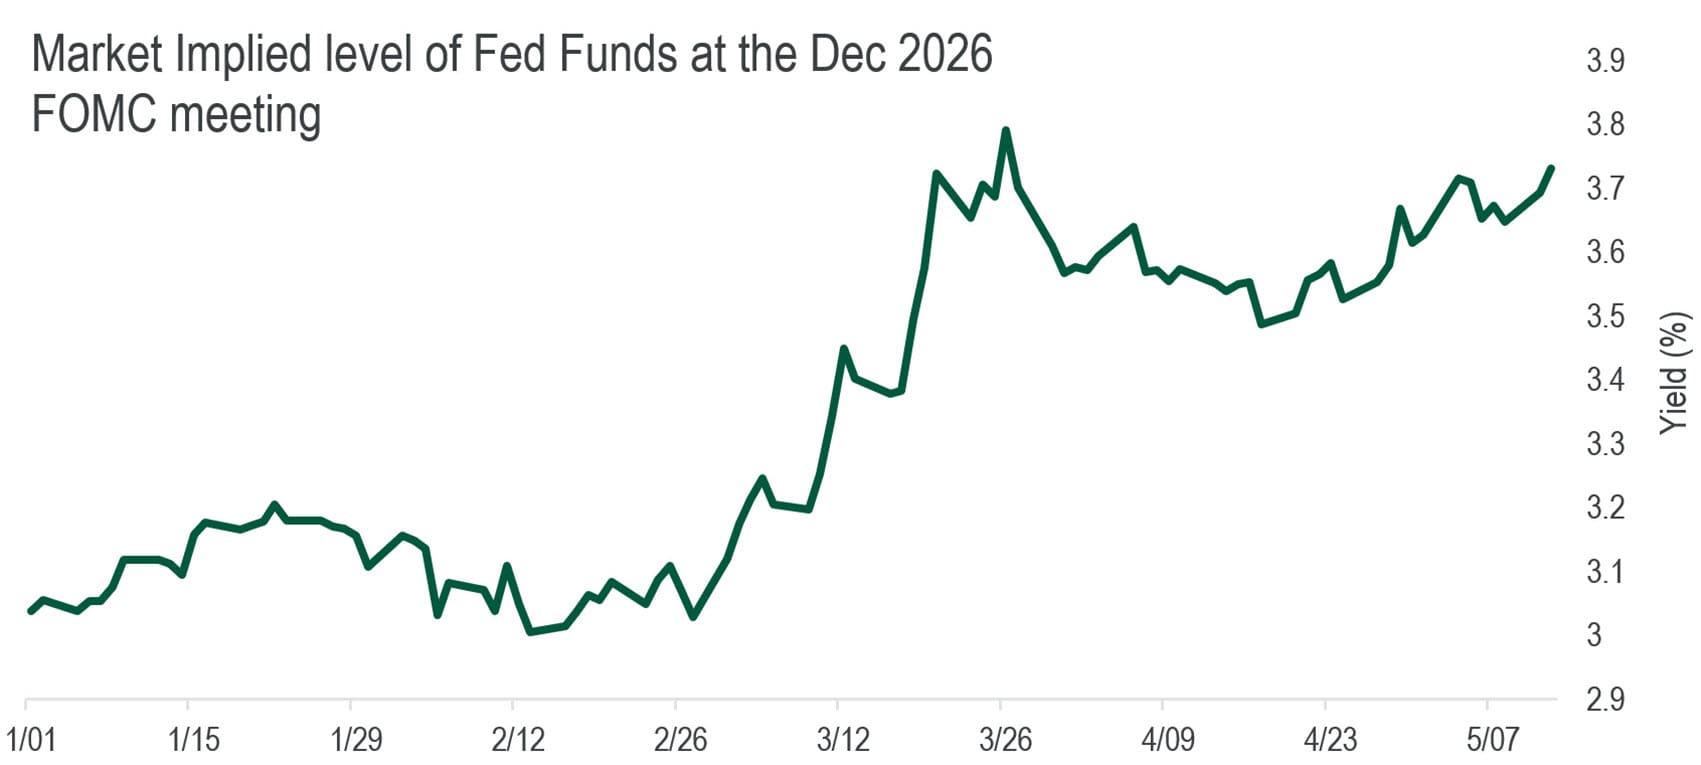
Source: Northern Trust Asset Management, Bloomberg. Market expectations implied by Fed Funds Futures. Data from 12/31/2025 through 5/12/2026. Historical trends are not predictive of future results.
- The FOMC again left its target range for the federal funds rate unchanged.
- It remains to be seen if the leadership transition from Powell to Warsh introduces yet another source of volatility for financial markets.
- U.S. Treasury yields are broadly consistent with our assessments of fair value. Within fixed income, we remain neutral duration, while favoring a steeper yield curve in eligible strategies.
Credit Markets
Easing geopolitical tensions and strong corporate earnings sparked a rally in risk assets during the month, with credit markets posting attractive returns from both price appreciation and coupon income. High yield bonds posted their best monthly return since last June, as spreads tightened 49 and moved near the tight end of their historical range. While spread valuations are less generous after the rally, the structure of the high yield market has also changed. Shorter-duration issuance, higher coupons and issuer patience in refinancing low-coupon debt have all contributed to a decline in index duration.
The high yield index’s modified duration is now 3.11 years, less than half the high-grade index’s 6.83, and below the long-term high yield average of 4.05. Average maturity at issuance has also fallen since the Fed’s rate-hike campaign, with recent years below the long-term average of 7.69 years. Meanwhile, the average maturity of the high yield index has declined to a record low of 4.8 years versus a long-term average of 6.7. Since duration and credit spreads are typically upward sloping, the shorter duration profile of the asset class may support structurally tighter high yield spreads versus history
HIGH YIELD STRUCTURAL CHANGES
The high yield index’s duration is materially shorter than in the past, helping drive tighter spreads.
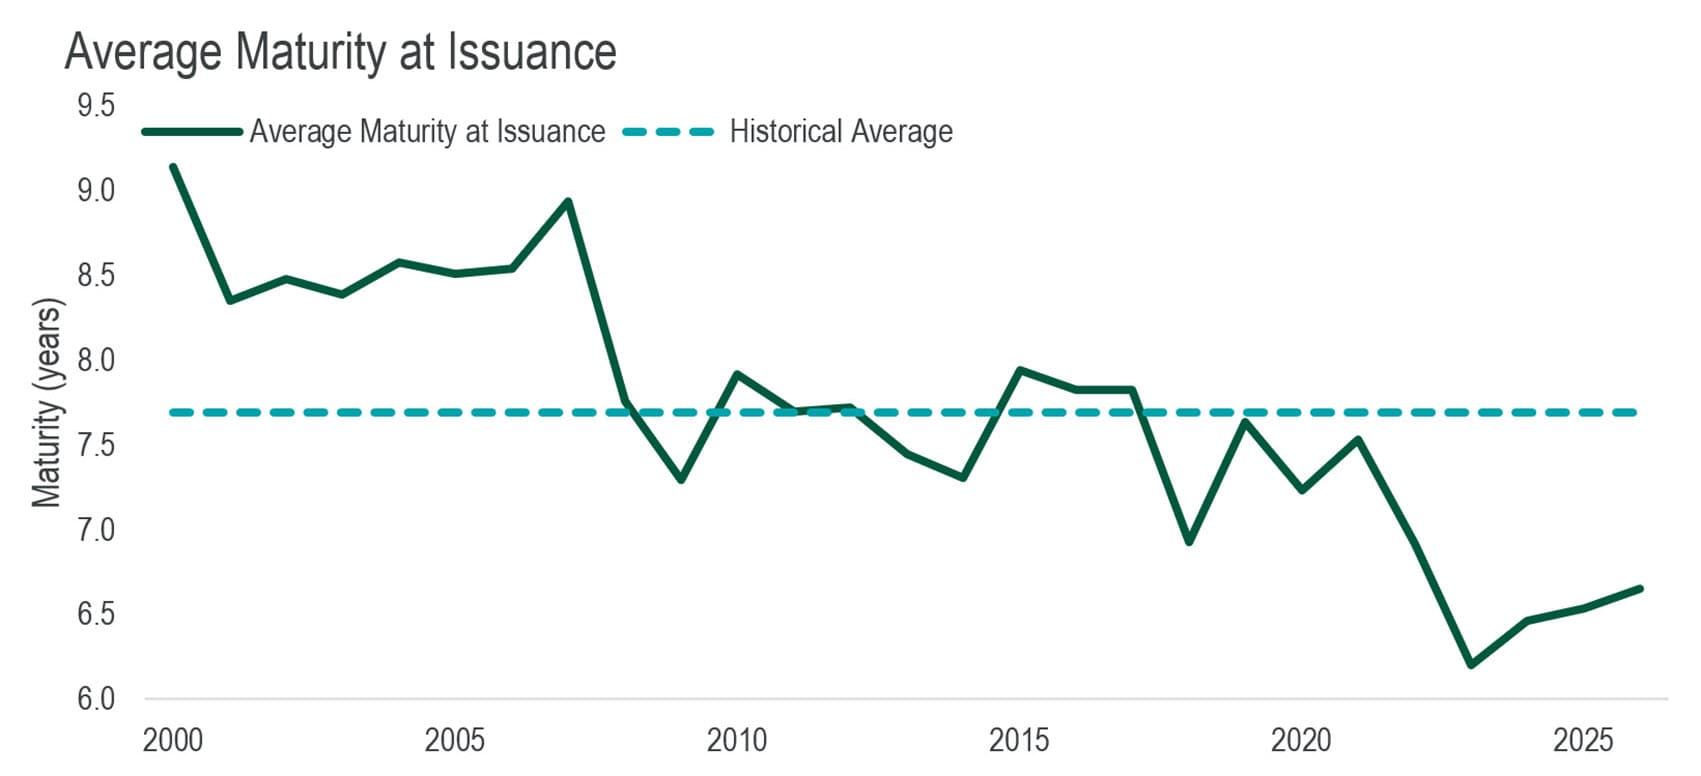
Source: Northern Trust Asset Management, JP Morgan. Historical trends are not predictive of future results. Data through April 2026.
- Shorter-duration issuance, higher coupons and issuer patience in refinancing low-coupon debt have pushed high yield index duration lower.
- The high yield index’s modified duration is 3.11yrs, close to its January 2026 record low of 2.93 and below its long-term average of 4.05.
- The decrease in the overall duration of the asset class could lead to a structural compression of high yield spreads overall versus history.
Equities
Corporate earnings cleared a high bar in the first quarter, far surpassing expectations from the start of the year. Despite ongoing geopolitical conflict and investor concerns around AI disruption, sentiment around the broader AI theme remains robust, helping push markets to fresh all-time highs. In April and mid-May, breadth narrowed meaningfully, with a handful of stocks leading the move higher. Semiconductor stocks were the clearest example. The , or SOX, is up 63% so far in 2026, underscoring the market’s focus on companies tied directly to the AI spending ecosystem.
Semiconductor demand linked to AI, data centers and advanced computing has driven strong revenue growth and positive earnings revisions. That growth has translated into meaningful operating leverage and stronger profits, aligning with investors’ focus on tangible earnings strength. Equities have shown resilience in absorbing macro uncertainty, while rewarding industries with clear secular growth drivers. We maintain a constructive yet disciplined stance toward equity exposure, balancing selectivity with prudent risk management as divergent scenarios persist.
- Jordan Dekhayser, Senior Equity Client Portfolio Manager
SEMICONDUCTOR OUTPERFORMANCE
Semiconductors have surged on AI-driven earnings.
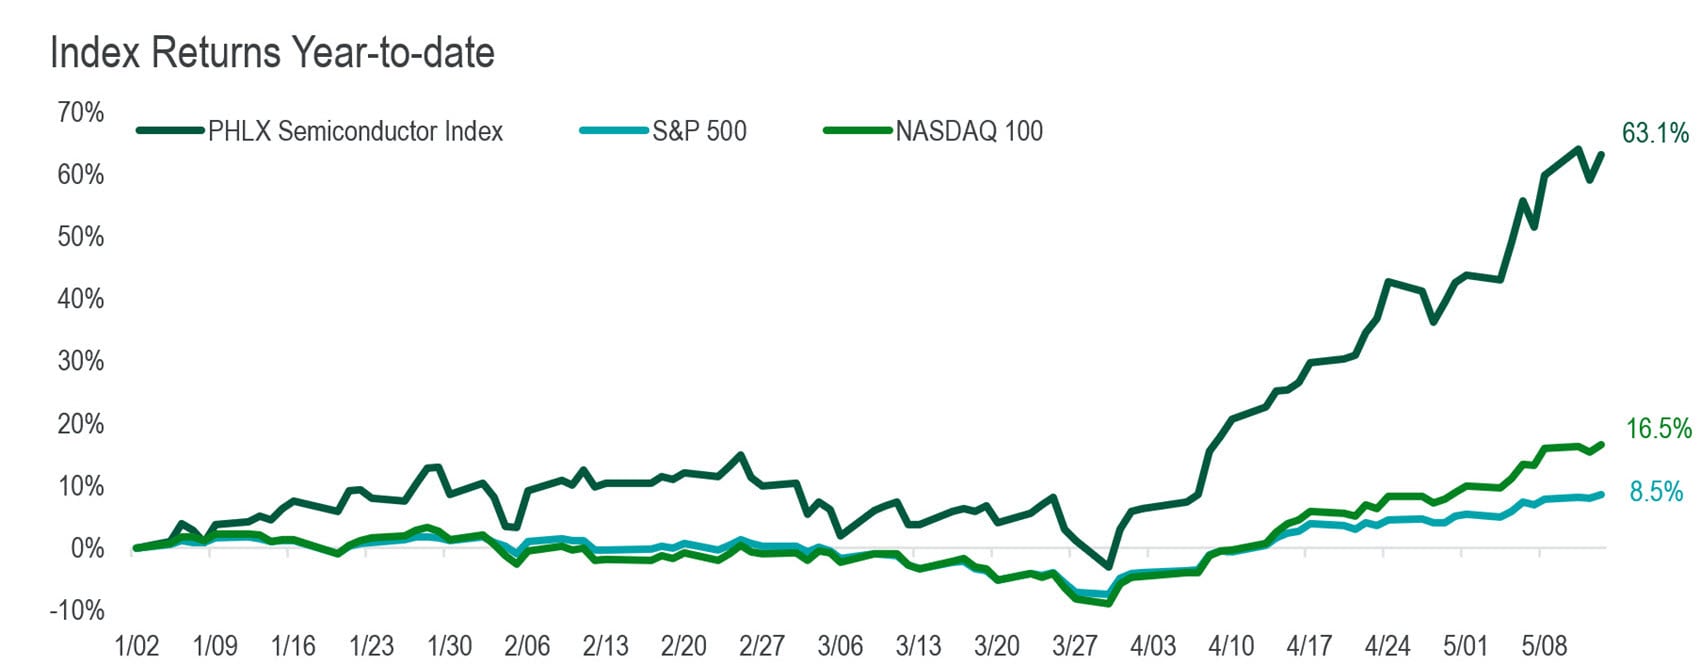
Source: Northern Trust Asset Management, Bloomberg. Data from 1/1/2026 through 5/13/2026. Past performance is not indicative or a guarantee of future results. Index performance returns do not reflect any management fees, transaction costs or expenses. It is not possible to invest directly in any index.
- Semiconductor stocks have surged on AI-driven earnings.
- Semiconductor demand tied to AI, data centers and advanced computing has driven strong revenue growth and earnings revisions.
- We maintain a constructive yet disciplined stance toward equities as markets remain resilient despite geopolitical risk and narrow breadth in the recent rally.
Real Assets
The rapid integration of artificial intelligence into everyday applications is driving a structural shift in how data centers are utilized and scaled. As AI moves from development into deployment, infrastructure needs are transitioning from building models to operating them continuously at scale, increasing the duration and stability of compute demand. AI Inference, the use of trained models to generate outputs in real time, is expected to become the primary driver of demand, overtaking traditional cloud and hyperscale workloads. Each interaction with applications such as Chat GPT requires immediate compute, creating continuous, recurring workloads rather than the episodic spikes associated with model training. Global data center demand is projected to grow through 2030, with inference driving most incremental capacity and expanding from roughly 21 GW to over 90 GW over the next 5 years.
Meanwhile, deployment models are evolving. AI Training remains centralized in large campuses, while Inference requires a more distributed, latency-sensitive network. As a result, data centers are increasingly operating like utilities, delivering always-on compute across geographically dispersed locations closer to end users.
ACCELERATING DATA CENTER DEMAND
AI Inference is driving an exponential increase in demand for data centers.
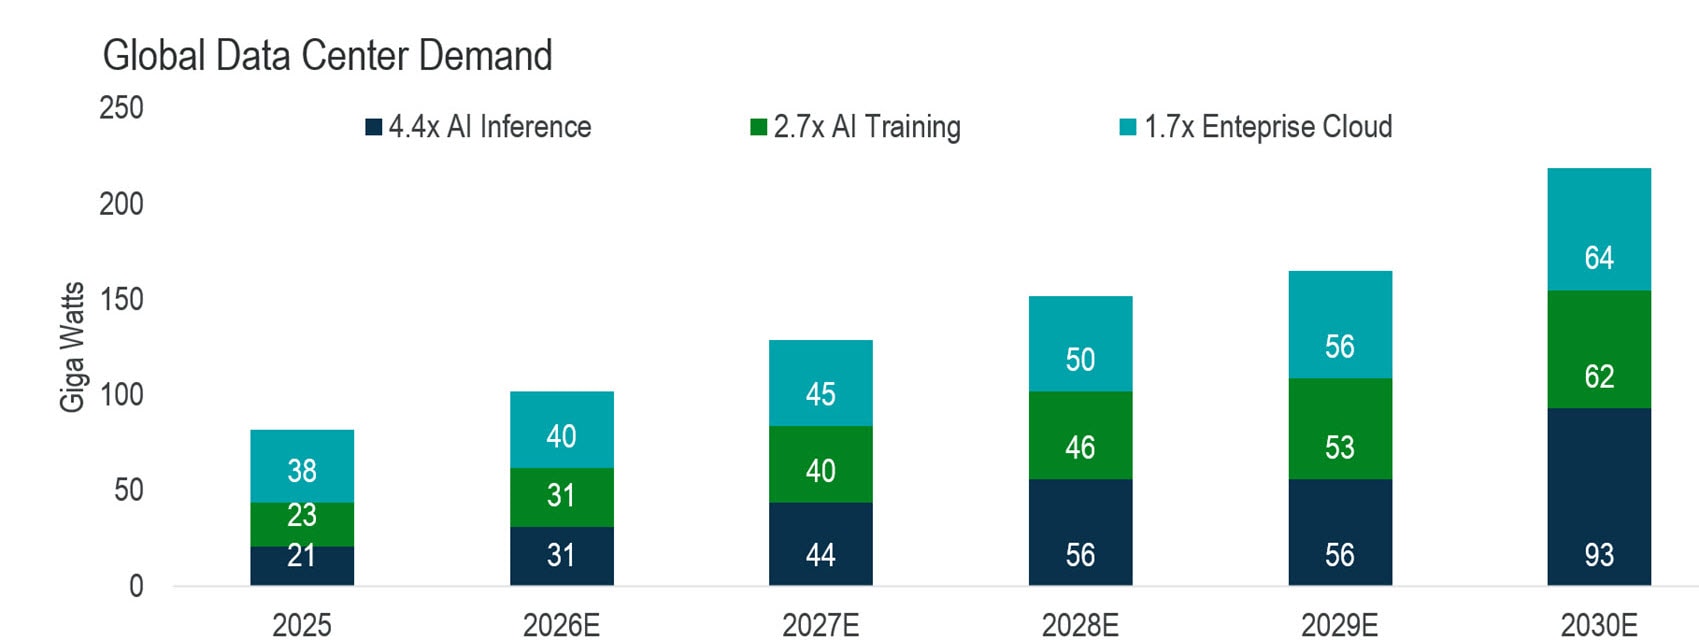
Source: Northern Trust Asset Management, Digital Realty, McKinsey. Forecasts and predictions are subject to change.
- AI Inference, the use of trained models to generate outputs in real time, is expected to become the primary driver of data center demand.
- It is becoming increasingly important that data centers provide power for continuous workloads and are located closer to end users.
- We reaffirmed our tactical overweight to global listed infrastructure on compelling fundamentals and accelerating earnings. We also recently trimmed our underweight to global real estate.
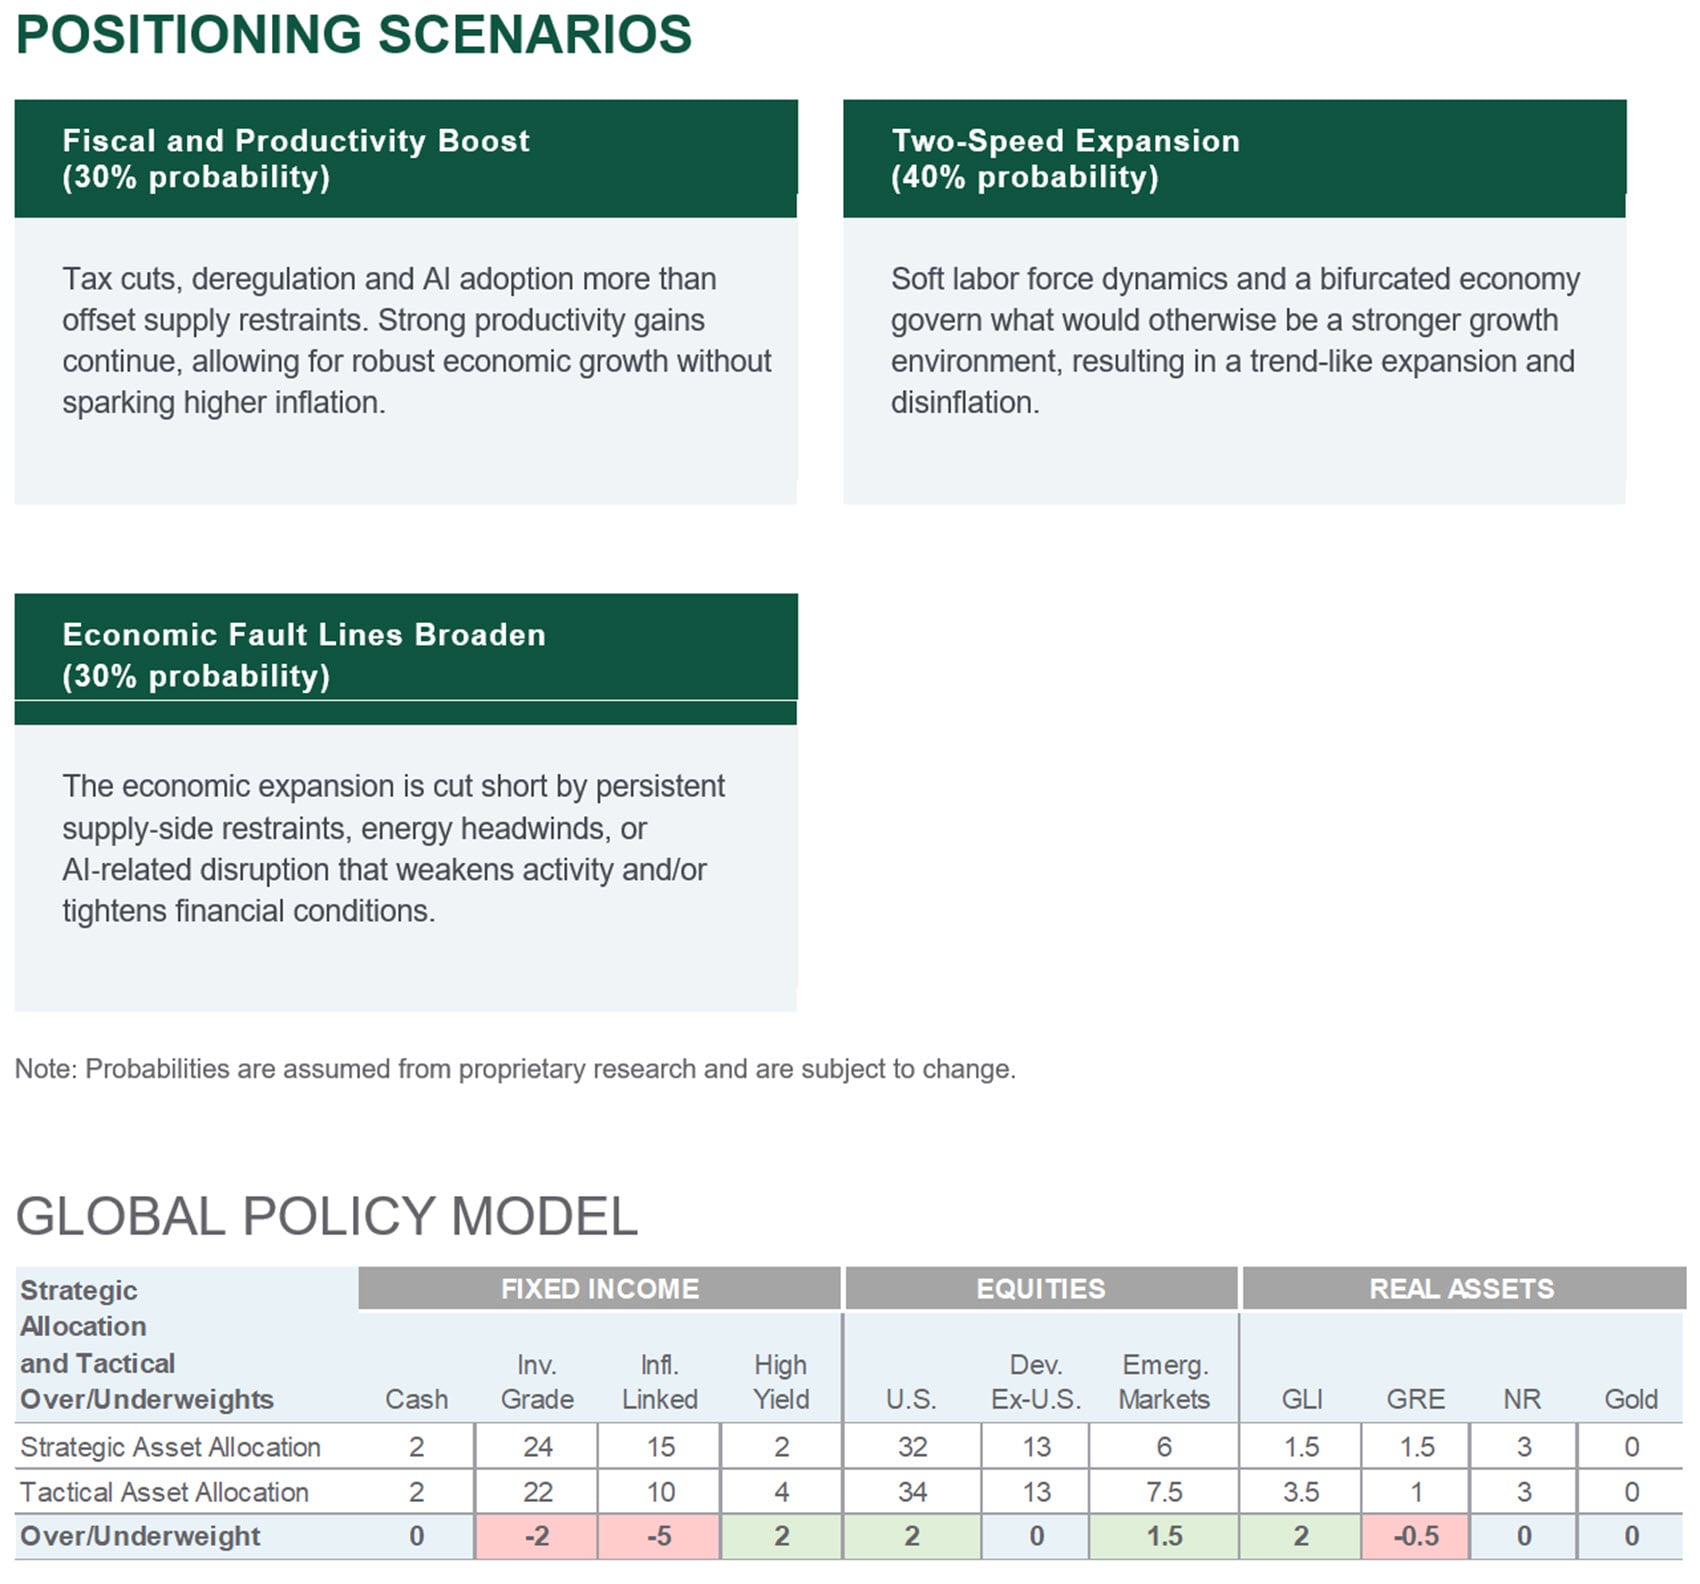
Source: Northern Trust Capital Market Assumptions Working Group, Investment Policy Committee. Strategic allocation is based on capital market return, risk and correlation assumptions developed annually; most recent model released 1/14/2026. The model cannot account for the impact that economic, market and other factors may have on the implementation and ongoing management of an actual investment strategy. Asset allocation does not guarantee a profit or protection against a loss in declining markets. GLI = Global Listed Infrastructure, GRE = Global Real Estate, NR = Natural Resources. Unless otherwise noted, the statements expressed herein are solely opinions of Northern Trust. Northern Trust does not make any representation, assurance, or other promise as to the accuracy, impact, or potential occurrence of any events or outcomes expressed in such opinions.
Unless noted otherwise, data in this piece is Sourced from Bloomberg as of May 2026.
Main Point
The Market Rally Is Powerful but Fragile
Stay constructive on equities, but mind the narrowness. When three semiconductor companies in Taipei and Seoul account for the lion’s share of one entire asset class’s earnings growth, the rally’s power and its fragility are two sides of the same coin.

Contact Us
Interested in learning more about our expertise and how we can help?
Additional Index Definitions:
Bloomberg Treasury Bills 1-3 Months: The Bloomberg U.S. Treasury Bills: 1-3 Months Index tracks the market for treasury bills issued by the U.S. government with time to maturity between 1 and 3 months. US Treasury bills are issued in fixed maturity terms of 4, 8, 13, 17, 26 and 52 weeks.
Bloomberg U.S. Treasury: The Bloomberg US Treasury Index measures US dollar-denominated, fixed-rate, nominal debt issued by the US Treasury. Treasury bills are excluded by the maturity constraint but are part of a separate Short Treasury Index. STRIPS are excluded from the index because their inclusion would result in double-counting. The US Treasury Index is a component of the US Aggregate, US Universal, Global Aggregate and Global Treasury Indices. The index includes securities with remaining maturity of at least one year.
Bloomberg Global Treasury: The Bloomberg Global Treasury Index tracks fixed-rate, local currency government debt of investment grade countries, including both developed and emerging markets. The index represents the treasury sector of the Global Aggregate Index.
Bloomberg Municipal: The Bloomberg Municipal Bond: Index is a flagship measure of the US municipal tax-exempt investment grade bond market. Included in the index are securities from all 50 US States and four other qualifying regions (Washington DC, Puerto Rico, Guam, and the Virgin Islands). The index includes state and local general obligation bonds and revenue bonds. All bonds in the Municipal Bond Index are tax exempt and hence are not eligible for other indices that include taxable bonds, such as the Bloomberg U.S. Aggregate.
Bloomberg U.S. TIPS: The Bloomberg US Treasury Inflation-Linked Bond Index (Series-L) measures the performance of the US Treasury Inflation Protected Securities (TIPS) market. Federal Reserve holdings of US TIPS are not index eligible and are excluded from the face amount outstanding of each bond in the index.
Bloomberg Global Inflation-linked: The Bloomberg Global Inflation Linked Index (Series-L) measures the investment-grade, government inflation-linked debt from 12 different developed market countries. Investability is a key criterion for inclusion of markets in this index, and it is designed to include only those markets in which a global government linker fund is likely and able to invest.
Bloomberg U.S. Aggregate: The Bloomberg US Aggregate Bond Index is a broad-based flagship benchmark that measures the investment grade, US dollar-denominated, fixed-rate taxable bond market. The index includes Treasuries, government-related and corporate securities, fixed-rate agency MBS, ABS and CMBS (agency and non-agency). Provided the necessary inclusion rules are met, US Aggregate-eligible securities also contribute to the multi-currency Global Aggregate Index and the US Universal Index.
Bloomberg Global Aggregate: The Bloomberg Global Aggregate Index is a flagship measure of global investment grade debt from twenty-seven local currency markets. This multi-currency benchmark includes treasury, government-related, corporate and securitized fixed-rate bonds from both developed and emerging markets issuers.
JP Morgan GBI – EM Global Diversified Composite Index: The J.P. Morgan Emerging Markets Bond Index Global Diversified tracks total returns for U.S. dollar-denominated debt instruments issued by emerging market sovereign and quasi-sovereign entities.
Bloomberg U.S. High Yield: The Bloomberg US Corporate High Yield Bond Index measures the USD-denominated, high yield, fixed-rate corporate bond market. Securities are classified as high yield if the middle rating of Moody’s, Fitch and S&P is Ba1/BB+/BB+ or below. Bonds from issuers with an emerging markets country of risk, based on the indices’ EM country definition, are excluded. The US Corporate High Yield Index is a component of the US Universal and Global High Yield Indices.
Bloomberg Global High Yield: The Bloomberg Global High Yield Index is a multi-currency flagship measure of the global high yield debt market. The index represents the union of the US High Yield, the Pan-European High Yield, and Emerging Markets (EM) Hard Currency High Yield Indices. The high yield and emerging markets sub-components are mutually exclusive.
MSCI AC World: The MSCI ACWI captures large and mid cap representation across 23 Developed Markets (DM) and 24 Emerging Markets (EM) countries.
MSCI USA: The MSCI USA Index is designed to measure the performance of the large and mid cap segments of the US market.
S&P 500: The index, a gauge of the large-cap U.S. equity market, includes 500 companies that represent approximately 80% of the market capitalization of publicly traded U.S. equities.
Russell 2000: The Russell 2000® Index measures the performance of the small-cap segment of the US equity universe.
Russell 1000 Growth: The Russell 1000® Growth Index measures the performance of the largecap growth segment of the US equity universe. It includes those Russell 1000 companies with relatively higher price-to-book ratios, higher I/B/E/S forecast medium term (2 year) growth and higher sales per share historical growth (5 years). The Russell 1000® Growth Index is constructed to provide a comprehensive and unbiased barometer for the large-cap growth segment. The index is completely reconstituted annually to ensure new and growing equities are included and that the represented companies continue to reflect growth characteristics.
Russell 1000 Value: The Russell 1000® Value Index measures the performance of the largecap value segment of the US equity universe. It includes those Russell 1000 companies with relatively lower price-to-book ratios, lower I/B/E/S forecast medium term (2 year) growth and lower sales per share historical growth (5 years). The Russell 1000® Value Index is constructed to provide a comprehensive and unbiased barometer for the large-cap value segment. The index is completely reconstituted annually to ensure new and growing equities are included and that the represented companies continue to reflect value characteristics.
MSCI World: The MSCI World Index captures large and mid cap representation across Developed Markets countries.
MSCI World ex US: The MSCI World ex USA Index captures large and mid cap representation across 22 of 23 Developed Markets (DM) countries*--excluding the United States. With 778 constituents, the index covers approximately 85% of the free float-adjusted market capitalization in each country.
MSCI Europe: The MSCI Europe Index captures large and mid cap representation across Developed Markets (DM) countries in Europe. The index covers approximately 85% of the free float-adjusted market capitalization across the European Developed Markets equity universe.
MSCI Japan: The MSCI Japan Index is designed to measure the performance of the large and mid cap segments of the Japanese market. The index covers approximately 85% of the free float-adjusted market capitalization in Japan.
MSCI Emerging Markets: The MSCI EM (Emerging Markets) Index is a free-float weighted equity index that captures large and mid cap representation across Emerging Markets (EM) countries. The index covers approximately 85% of the free float-adjusted market capitalization in each country.
MSCI China: The MSCI China Index captures large and mid cap representation across China A shares, H shares, B shares, Red chips, P chips and foreign listings (e.g. ADRs). The index covers about 85% of this China equity universe. Currently, the index includes Large Cap A and Mid Cap A shares represented at 20% of their free float adjusted market capitalization.
S&P Global Natural Resources: The index includes 90 of the largest publicly-traded companies in natural resources and commodities businesses that meet specific investability requirements, offering investors diversified and investable equity exposure across 3 primary commodity-related sectors: agribusiness, energy, and metals & mining.
S&P Global Infrastructure: The S&P Global Infrastructure Index is designed to track 75 companies from around the world chosen to represent the listed infrastructure industry while maintaining liquidity and tradability. To create diversified exposure, the index includes three distinct infrastructure clusters: energy, transportation, and utilities.
MSCI ACWI IMI Core Real Estate: The MSCI ACWI IMI Core Real Estate Index is a free float-adjusted market capitalization index that consists of large, mid and small-cap stocks across 23 Developed Markets (DM) and 24 Emerging Markets (EM) countries* engaged in the ownership, development and management of specific core property type real estate. The indexexcludes companies, such as real estate services and real estate financing companies, that do not own properties.
CBOE Volatility Index: The Cboe Volatility Index (VIX Index) is a leading measure of market expectations of near-term volatility conveyed by S&P 500 Index option prices.
CBOE Crude Oil Volatility Index: The Cboe Crude Oil ETF Volatility Index (OVX) is an estimate of the expected 30-day volatility of crude oil as priced by the United States Oil Fund (USO).
Philadelphia Stock Exchange Semiconductor Index: The Philadelphia Semiconductor Index is a modified capitalization-weighted index comprised of companies that are involved in the design, distribution, manufacturing, and sale of semiconductors.
NASDAQ-100 Index: The NASDAQ-100 Index is a modified capitalization-weighted index of the 100 largest and most active non-financial domestic and international issues listed on the NASDAQ. No security can have more than a 24% weighting.
IMPORTANT INFORMATION
The information contained herein is intended for use with current or prospective clients of Northern Trust Investments, Inc (NTI) or its affiliates. The information is not intended for distribution or use by any person in any jurisdiction where such distribution would be contrary to local law or regulation. (NTI) or its affiliates may have positions in and may effect transactions in the markets, contracts and related investments different than described in this information. This information is obtained from sources believed to be reliable, its accuracy and completeness are not guaranteed, and is subject to change. Information does not constitute a recommendation of any investment strategy, is not intended as investment advice and does not take into account all the circumstances of each investor.
This report is provided for informational purposes only and is not intended to be, and should not be construed as, an offer, solicitation or recommendation with respect to any transaction and should not be treated as legal advice, investment advice or tax advice. Recipients should not rely upon this information as a substitute for obtaining specific legal or tax advice from their own professional legal or tax advisors. References to specific securities and their issuers are for illustrative purposes only and are not intended and should not be interpreted as recommendations to purchase or sell such securities. Indices and trademarks are the property of their respective owners. Information is subject to change based on market or other conditions.
All securities investing and trading activities risk the loss of capital. Each portfolio is subject to substantial risks including market risks, strategy risks, advisor risk, and risks with respect to its investment in other structures. There can be no assurance that any portfolio investment objectives will be achieved, or that any investment will achieve profits or avoid incurring substantial losses. No investment strategy or risk management technique can guarantee returns or eliminate risk in any market environment. Risk controls and models do not promise any level of performance or guarantee against loss of principal. Any discussion of risk management is intended to describe (NTI) or its affiliates’ efforts to monitor and manage risk but does not imply low risk.
Past performance is not a guarantee of future results. Performance returns and the principal value of an investment will fluctuate. Performance returns contained herein are subject to revision by (NTI) or its affiliates. Comparative indices shown are provided as an indication of the performance of a particular segment of the capital markets and/or alternative strategies in general. Index performance returns do not reflect any management fees, transaction costs or expenses. It is not possible to invest directly in any index. Net performance returns are reduced by investment management fees and other expenses relating to the management of the account. Gross performance returns contained herein include reinvestment of dividends and other earnings, transaction costs, and all fees and expenses other than investment management fees, unless indicated otherwise. For NTI prospects or clients, please refer to Part 2a of the Form ADV or consult an NTI representative for additional information on fees.
Forward-looking statements and assumptions are (NTI) or its affiliates’ current estimates or expectations of future events or future results based upon proprietary research and should not be construed as an estimate or promise of results that a portfolio may achieve. Actual results could differ materially from the results indicated by this information.
Northern Trust Asset Management is composed of Northern Trust Investments, Inc. Northern Trust Global Investments Limited, Northern Trust Fund Managers (Ireland) Limited, Northern Trust Global Investments Japan, K.K, NT Global Advisors, Inc., 50 South Capital Advisors, LLC, Northern Trust Asset Management Australia Pty Ltd, and investment personnel of The Northern Trust Company of Hong Kong Limited and The Northern Trust Company.
NOT FDIC INSURED | MAY LOSE VALUE | NO BANK GUARANTEE
© 2026 Northern Trust Corporation. Head Office: 50 South La Salle Street, Chicago, Illinois 60603 U.S.A.